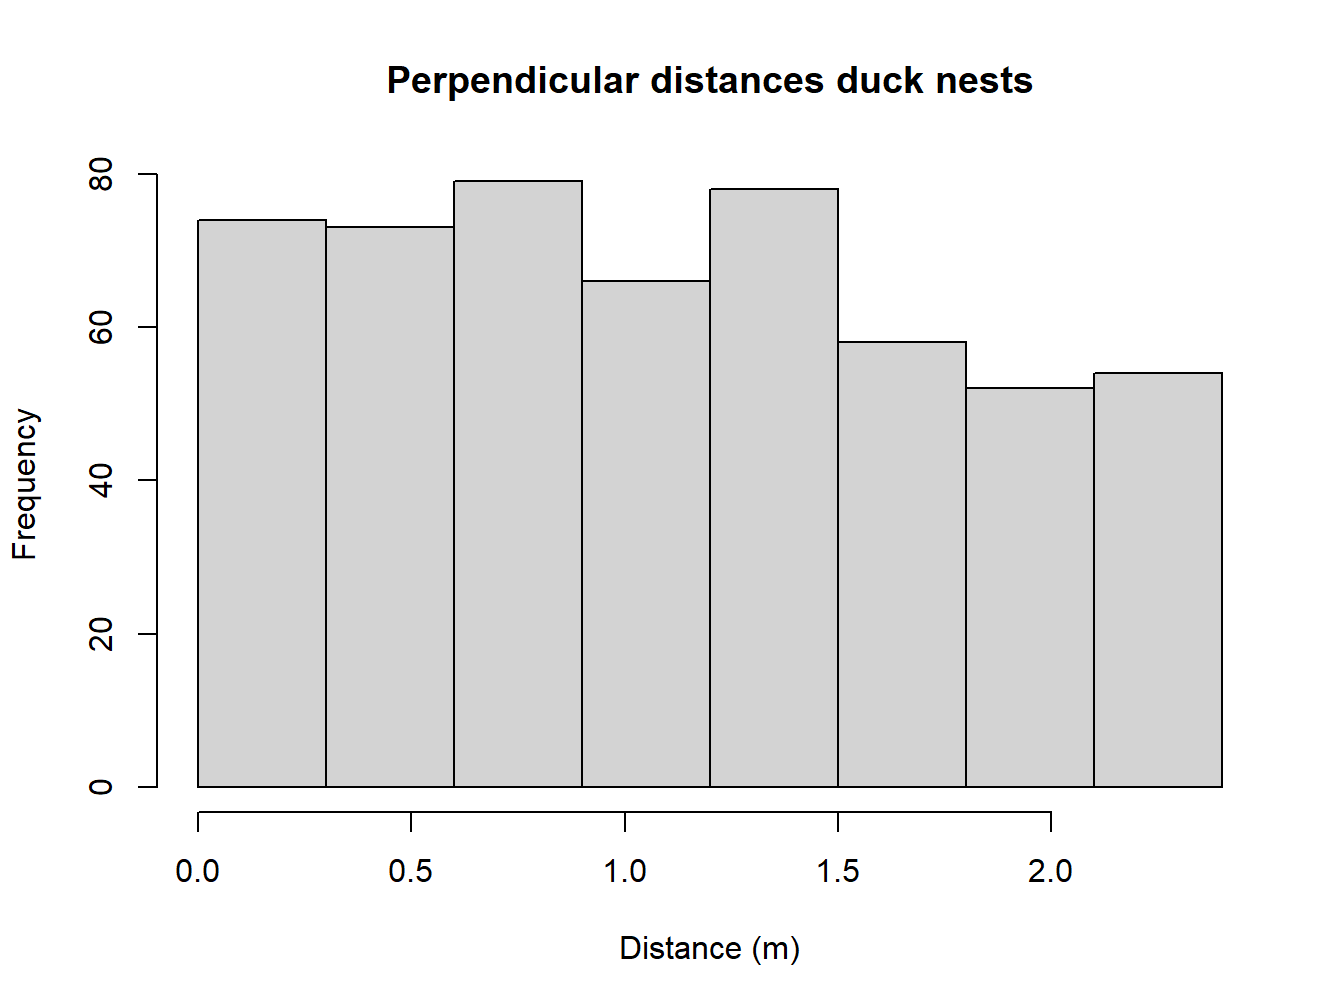
Distribution of duck nest perpendicular distances. Should match the bar heights from table in Practical 1.
Fit detection functions
Fit the three models using proper units of distance measure.
The answer is another function convert_units. Arguments to this function are
distance_units
units of measure for perpendicular/radial distances
effort_units
units of measure for effort (NULL for point transects)
area_units
units of measure for the study area.
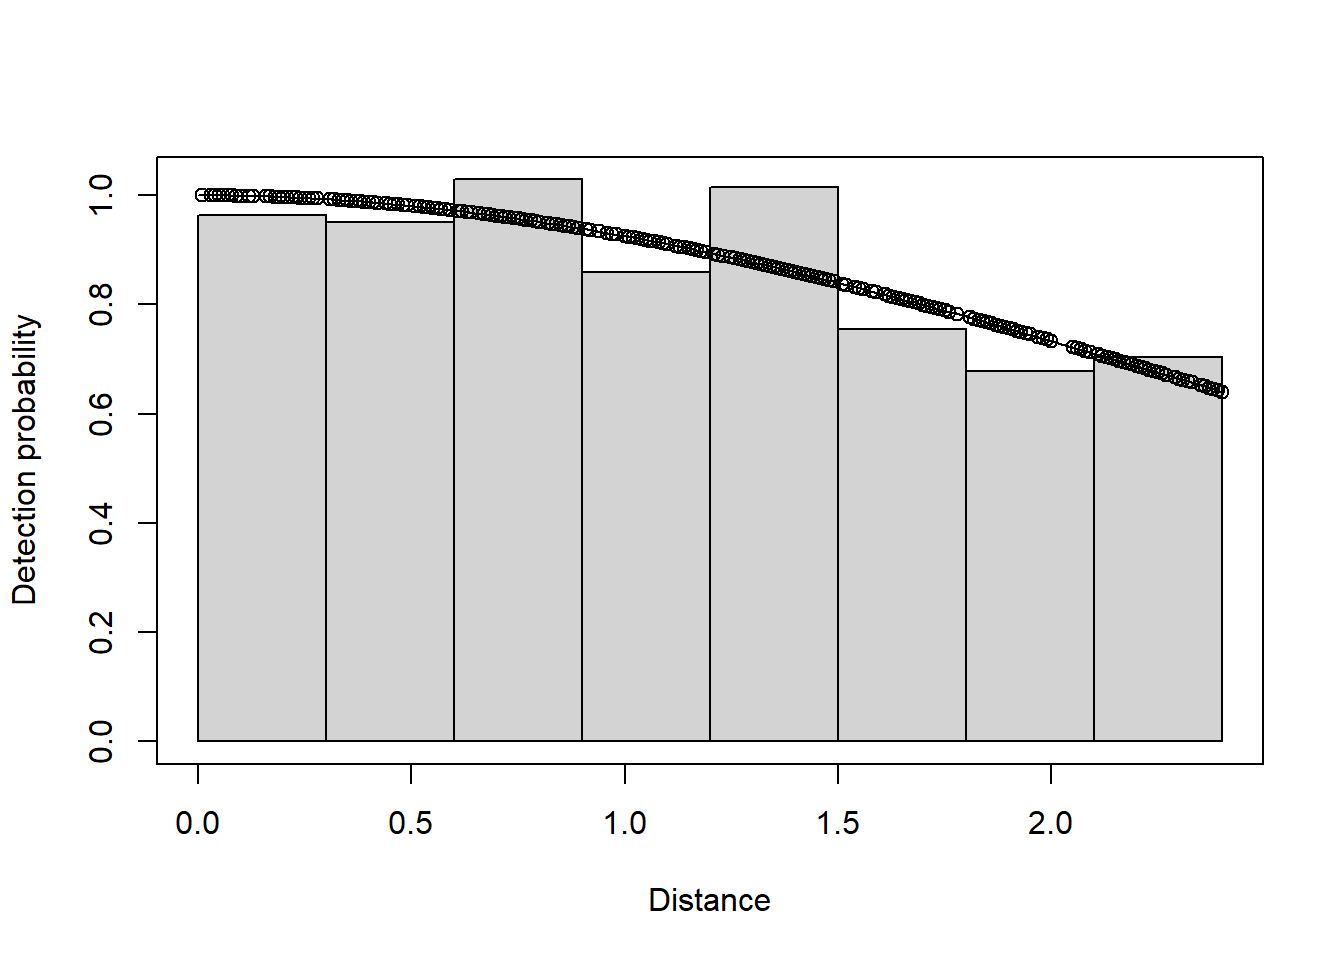
conversion.factor <-convert_units("Meter", "Kilometer", "Square Kilometer")# Half-normal with no adjustmentsnest.hn <-ds(ducknest, key="hn", adjustment=NULL, convert_units=conversion.factor)summary(nest.hn)
Summary for distance analysis
Number of observations :  534
Distance range         :  0  -  2.4

Model       : Half-normal key function
AIC         :  928.1338
Optimisation:  mrds (nlminb)

Detection function parameters
Scale coefficient(s):
             estimate        se
(Intercept) 0.9328967 0.1703933

                       Estimate          SE         CV
Average p             0.8693482  0.03902051 0.04488479
N in covered region 614.2533225 29.19681554 0.04753221

Summary statistics:
   Region  Area CoveredArea Effort   n  k        ER       se.ER      cv.ER
1 Default 12.36       12.36   2575 534 20 0.2073786 0.007970756 0.03843576

Density:
  Label Estimate       se         cv     lcl      ucl       df
1 Total 49.69687 2.936724 0.05909274 44.2033 55.87318 99.55677
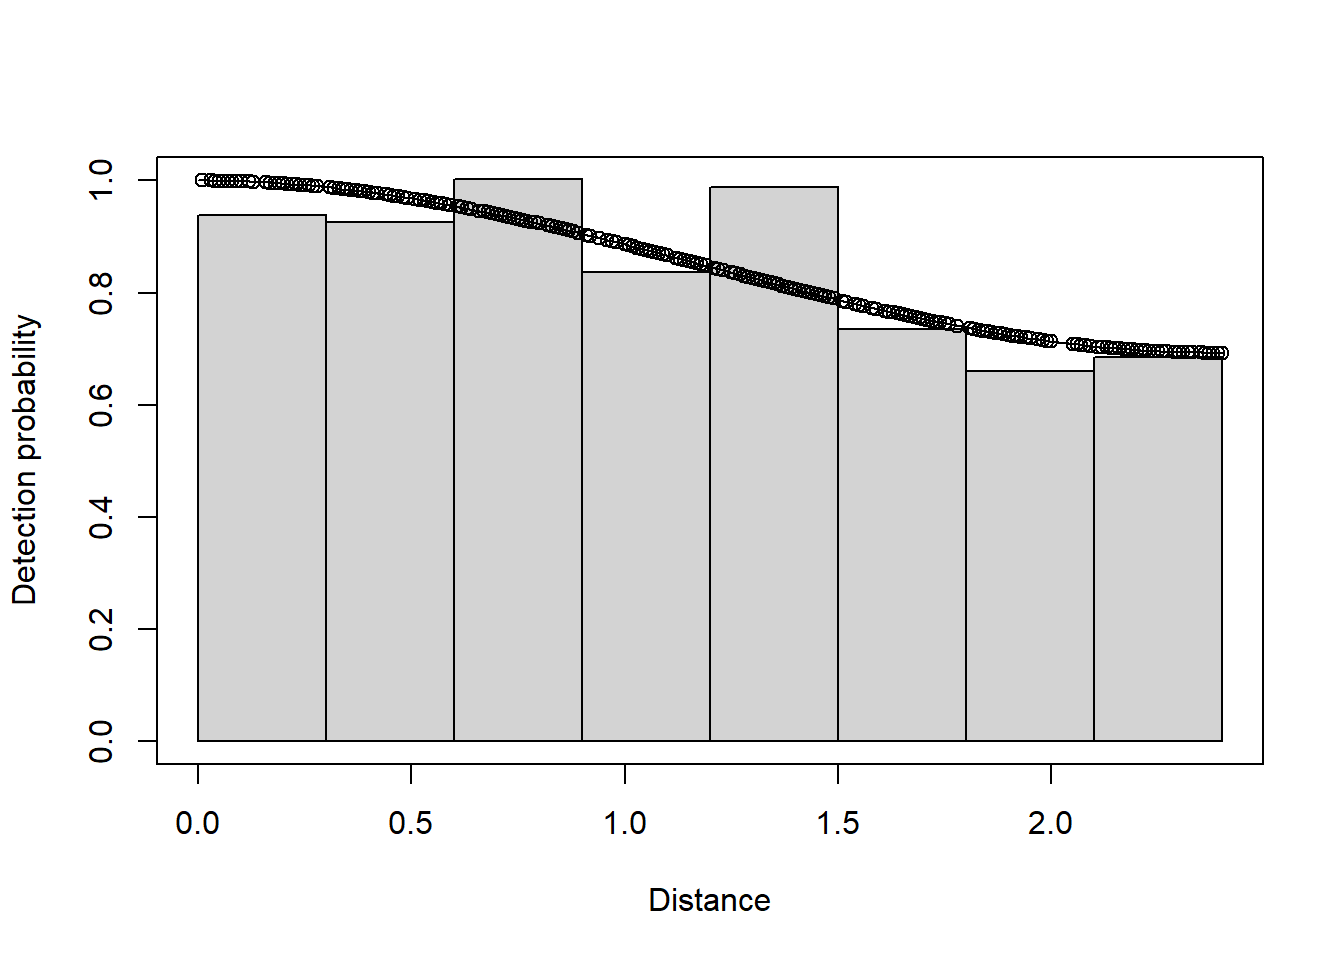
In addition to the half normal key function, fit uniform and hazard rate models with possible adjustment terms.
The half-normal detection function with no adjustments has the smallest AIC which provides support for this model. The \(\Delta\)AIC values for all three models is small. In general, you should get similar density estimates using different detection function models, provided those models fit the data well, as in this example.