Making sense of fitted model objects
Below is output produced from fitting a hazard rate key function (without adjustment terms) to the ducknest data set. It is important to study model output, not just focus upon the estimated density. There may be clues in the output to indicate that data have not been analysed as you intended (misspecification of truncation distances, mistyping of the key function, etc.)
First four lines are R code to fit the model, remainder of lines is output produced by the summary() function.
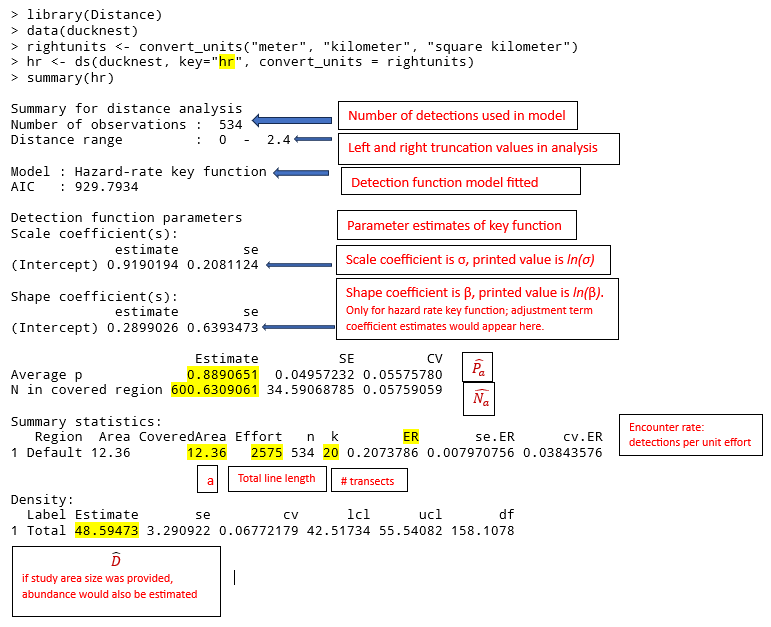
I have not labelled everything to prevent the image from becoming too cluttered. I have not labelled the different measures of precision associated with estimates and summary statistics. I have not fitted a model that included adjustment terms; had I done so, the output would also have contained estimates of the adjustment term coefficients (\(\alpha_i\)) and their measures of precision.
The ducknest data are objects that appear singly (not in groups). Has this been a model fitted to objects that were detected as clusters, there would have been additional output. Likewise, if the survey had been a stratified survey, there would have been density (and abundance) estimates for each stratum.
The labelled output should assist you in navigating the model objects created by the ds() function.